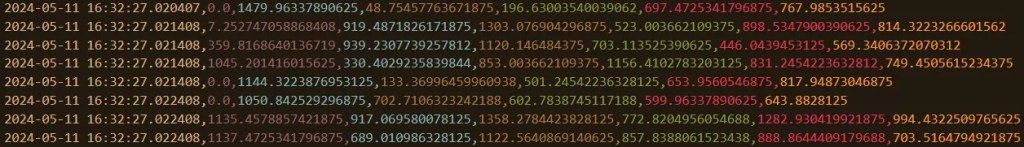
In exploring my Muse headband I ended up building a small application that allows you to stream the data output from the headband via a live visualization, or directly to a CSV (text) file on your computer. This gave me an idea to build an application to visualize the data using Python.
Making the Muse Headband Data Readable in Python
Connect Muse headband to something that can produce an Open Sound Control (OSC) stream of data. Simply put, this is just a framework designed to communicate high-frequency data over a network. In our case, we’re using the Muse Direct application to produce the OSC stream. An app called Mind Monitor works as an OSC transmitter paired with the Muse headband.
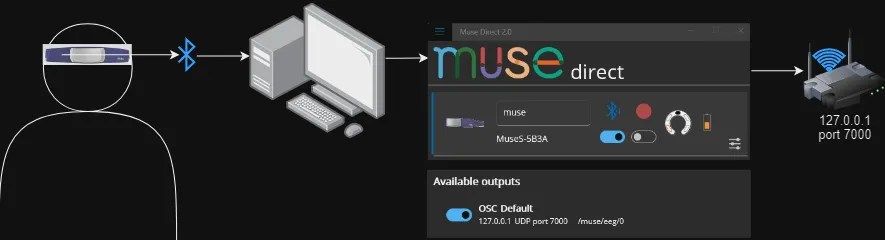
The headband connects via Bluetooth to our computer, which is running the Muse Direct/Mind Monitor application, which is transmitting our OSC stream on a local network.
Building the Python App
Once the OSC stream is up and running, we can then read it using an open source library in Python called python-osc. This allows us to “read” the data into a common structure such that we can then use that data for our application. In this project we’re using PyQt6as our application building framework for one simple reason: speed. Our data streams in at 256 hertz, or 256 times per second (approximately). Although our graph does not update quite that often, its still pretty frequent. For this reason, PyQt6 & subsequently PyQtgGraph are used to create this live brainwave app.

Live Brainwave EEG App
Overview
The Live Brainwave EEG App is a visualization tool designed to display real-time EEG data from the Muse headband. This application leverages the Muse headband to capture EEG signals, which are then processed and visualized dynamically, providing insights into brain activity. This app is particularly useful for researchers, educators, and enthusiasts interested in neurofeedback and brain-computer interfaces.
This is a PyQt6 app built to simply visualize in real-time the output from our Muse device.
Prerequisites
- Muse Headband: This application requires a Muse headband to capture EEG data.
- SDK Access: You must have access to the Muse SDK or use a compatible application such as Mind Monitor (app store, costs money) to fetch and stream EEG data.
- Python Environment: The application is developed in Python, requiring an environment with Python 3.6 or later.
- PyQt6 and Other Dependencies: Installation of PyQt6 and other required libraries.
Installation on Windows
This is how you do it on windows with pip, but this will work in any python environment.
git clone https://github.com/rbuttery/live_eeg_visualization_app.git
cd muse_eeg_live_brainwave_app
python -m venv env
env\scripts\activate
pip install -r requirements.txt
To run the app in Python:
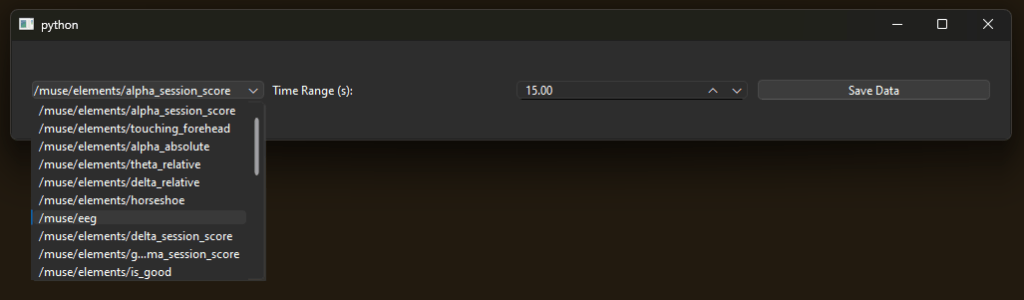
python muse_receiver_app.pyRun & Select which channel you want to see first.
Visualize your brainwaves!

Available Streams
- 6 Channels of EEG that measure electrical activity in the brain.
- PPG measures blood volume changes.
- Accelerometer and Gyroscope to measure acceleration and orientation.
- Other information about:
- battery life
- whether the jaw is clenched
- eyes open or not
Specify the time range to show on the graph (X Axis). This also would the the time range specified in the export when you press the Save Data button, which of course is the 3rd feature.
“Save Data” is a button that will just export all the data shown on the screen to a CSV (text) file.
Biggest Challenges, Lessons
Building this application was a fun experiment & deep dive into the various kinds of data available in the Muse headband. Some of the main things that I learned are:
Signal Processing Is Complex
Honestly one of the biggest thing that I learned was how complex this data truly is. The data you see, for example the EEG data, one could almost assume that each channel was tuned to pick up a specific frequency of EEG (like channel 1 = Alpha, channel 2 = Beta) but that is not the case. The process to extract the various frequencies from the EEG channels would need further preprocessing, feature extraction, and classification in order to produce any real useful insights. This is the case with every data type, as each channel can contain noise, spikes, or even missing data.
Application Building Is Hard, Even With the Right Tools
As a Data Analyst/Data Scientist, I first tried building this app with frameworks I was familiar with like Matplotlib, Plotly Streamlit, Gradio but struggled in the live stream part of the app. After some research, I found PyQT6 and PyQtGraph and it worked really well.
On top of the technical challenges, building an application that end up being useful to people needs to involve said people. My only goal was to visualize the data produced by the Muse headband, which we did! However the resulting application fails to deliver any true value as the data is not intuitive to understand & is limited in its functionality.
Final Thoughts
This was a fun project and I learned a lot about EEG data, the methods required for preprocessing this kind of raw biometric data, and the complexities of EEG and application building. For developers wanting to explore biometric data & raw signals, the Muse headband combined with Python-OSC & PyQt6 frameworks provide the tools capable of simplifying the process of reading and interpreting human biometric data, which is pretty wild when you think about it.

Leave a comment